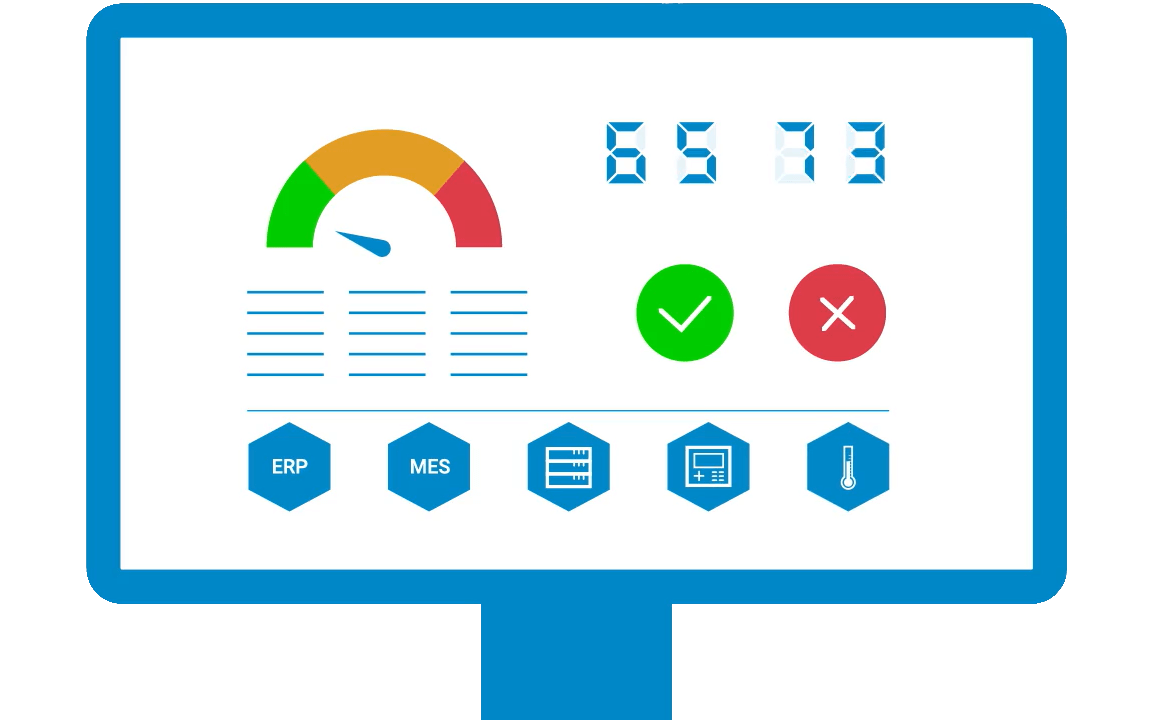
Industrial production sites generate huge amounts of data. Machine controllers, sensors, RFID systems, MES and ERP are just some of the potential data sources. But only the right structuring and visualization makes it possible to gain valuable insights from this data. So the question remains: Is it worth the effort?
In this article, we take a look at five practical use cases to show how manufacturing companies can benefit from visualizing their production data.

1. Data-driven decision making in real-time
Modern production environments are unique and highly complex. Data visualizations in the form of custom dashboards can help maintain an overview despite this complexity. Most importantly, they offer the opportunity to localize problems immediately.
- Spot slowing production lines before they become major bottlenecks.
- Identify underperforming equipment and address issues promptly.
- React quickly to quality deviations, minimizing waste and rework.
Used correctly, diagrams, tables and status indicators provide a real-time overview of machine status, production rates and quality metrics.
2. Root cause analysis
Problems in production are inevitable. The difference between swift resolution and costly downtime often lies in how you analyze data. Visualizations excel at revealing hidden relationships:
- Correlations: Do production dips coincide with specific machine temperature spikes, suggesting overheating issues?
- Trends: Does a gradual decline in quality point to tool wear in need of maintenance?
- Outliers: Visualizations instantly highlight unusual data points, prompting deeper investigation into their cause.
3. Performance tracking with OEE
Overall Equipment Effectiveness (OEE) is one of the leading production metrics for measuring production efficiency. It is divided into three components, each of which provides valuable insights into the performance of a production plant:
Availability: The visualization of operating times and failure patterns can be used to evaluate maintenance schedules. It also shows whether and how often production is affected by unexpected breakdowns.
Performance: Are individual machines achieving production targets? Visual comparisons across shifts and/or machine types quickly show which machines are underperforming.
Quality: Tracking quality trends reveals, whether scrap rates and rework are above the expected level.
4. Predictive Maintenance
Unplanned downtime can be a major burden for modern production environments where every machine plays an important role. Comprehensive visualization of equipment performance over time can provide early warning signs of problems and help to better plan maintenance.
- Wear and tear: Gradual changes in vibration patterns or power consumption can indicate component wear, allowing early replacements to be made.
- Threshold warnings: Set visual alerts when critical thresholds are reached to allow timely intervention before failure.
5. Continuous improvement
Data visualization is not just about the here and now, but also about uncovering long-term trends. By tracking your key performance indicators over weeks, months or even years, you are able to identify the impact of past decisions:
- Process changes: Did optimizing a production step lead to a noticeable improvement in quality? Visualizations make the impact clear.
- Identification of bottlenecks: Identify which production steps consistently cause delays and prioritize planned optimizations.
- Benchmarking: Compare the performance of different shifts, equipment or production lines with each other. This allows you to evaluate measures at individual locations and expand them if appropriate.
manubes
Innovative cloud solution for industrial production management
Our innovative manubes platform is an example of a large-scale, cloud-based solution tailored to industrial production management. manubes allows users to collect and structure production data, create highly customizable real-time visualizations and reports and manage various production processes using automated workflows.
manubes focuses on simple no-code operation, worldwide access and maximum security.


Recent Comments